How to Set Up Performance Monitoring with New Relic in a Next.js Application
This post is also available in .
Introduction
In modern web applications, performance optimization and continuous monitoring are becoming increasingly important. Especially for applications built with modern frameworks like Next.js, it is essential to ensure smooth operation without compromising user experience. However, identifying the root cause of issues is not always easy.
This is where "New Relic" comes in. New Relic is a powerful tool that monitors application performance in real time and quickly identifies bottlenecks and error locations. In this article, we will clearly explain how to introduce and utilize New Relic in a Next.js application.
Through this guide, you will experience how the introduction of monitoring tools can streamline application operations and reduce the burden on developers.
We will proceed based on the official tutorial, adding supplementary information as we go.
Here is the official New Relic tutorial:
Goal of This Guide
We will introduce the New Relic NPM package into a Next.js project.
After that, we will make it possible to check errors that occur on the server side with New Relic.
Similarly, we will configure it so that errors occurring on the client side can also be captured by New Relic and check the error details from the management console.
New Relic can also obtain detailed information such as which devices the errors occurred on, making investigation smoother for developers.
About New Relic
New Relic is an all-in-one monitoring tool for visualizing and resolving issues by monitoring the performance of applications and infrastructure. As a cloud-based service, it is used by developers and operations teams to maintain system health and optimize performance.
Main Features
- Application Performance Monitoring (APM)
- Tracks the internal behavior of applications in detail and identifies the causes of request delays and errors.
- Especially excels at transaction tracing and detecting database query bottlenecks.
- Infrastructure Monitoring
- Tracks resource usage of servers, containers, cloud infrastructure, etc.
- Allows metric collection and alert settings for anomaly detection.
- Distributed Tracing
- Visualizes communication between microservices and identifies data flow and latency points across the system.
- Particularly useful for troubleshooting in complex distributed systems.
- Log Management and Analysis
- Aggregates application and server logs, enabling real-time search and analysis.
- Integrates with other monitoring data for rapid troubleshooting.
- User Experience Monitoring
- Measures what kind of experience users actually have on web and mobile applications.
- Tracks page load times and error rates, clarifying points for UX improvement.
- Alerts and Dashboards
- Allows setting alerts based on metrics and receiving notifications when anomalies occur.
- Customizable dashboards provide visual confirmation of real-time data.
Benefits
- High integration: Efficient problem detection by centrally monitoring applications, infrastructure, logs, etc.
- Multi-platform support: Usable in cloud (AWS, GCP, Azure) and on-premises environments.
- Rich language support: Supports many programming languages such as Java, Node.js, Python, Ruby, PHP.
Use Cases
- When web application response is slow, analyze where bottlenecks occur in database or external API connections.
- When server CPU or memory usage spikes, receive alerts and respond quickly.
- Identify communication delays between microservices and rebuild service dependencies.
Comparison with Competing Tools
New Relic competes with other monitoring tools such as Datadog and Dynatrace, but it is said to have a long history and a good balance of usability and features, especially in the APM field.
Setting Up New Relic
Account Registration
Let's register for a New Relic account and get it ready for use.
Please proceed from the following URL.
You can create an account for free.
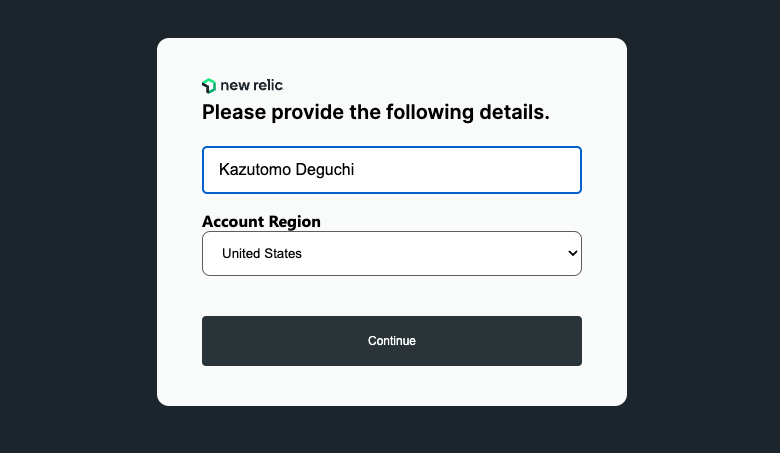
Once you set your name and region, account registration is complete.
Application Setup
In New Relic, you set up an "application" as a unit of monitoring.
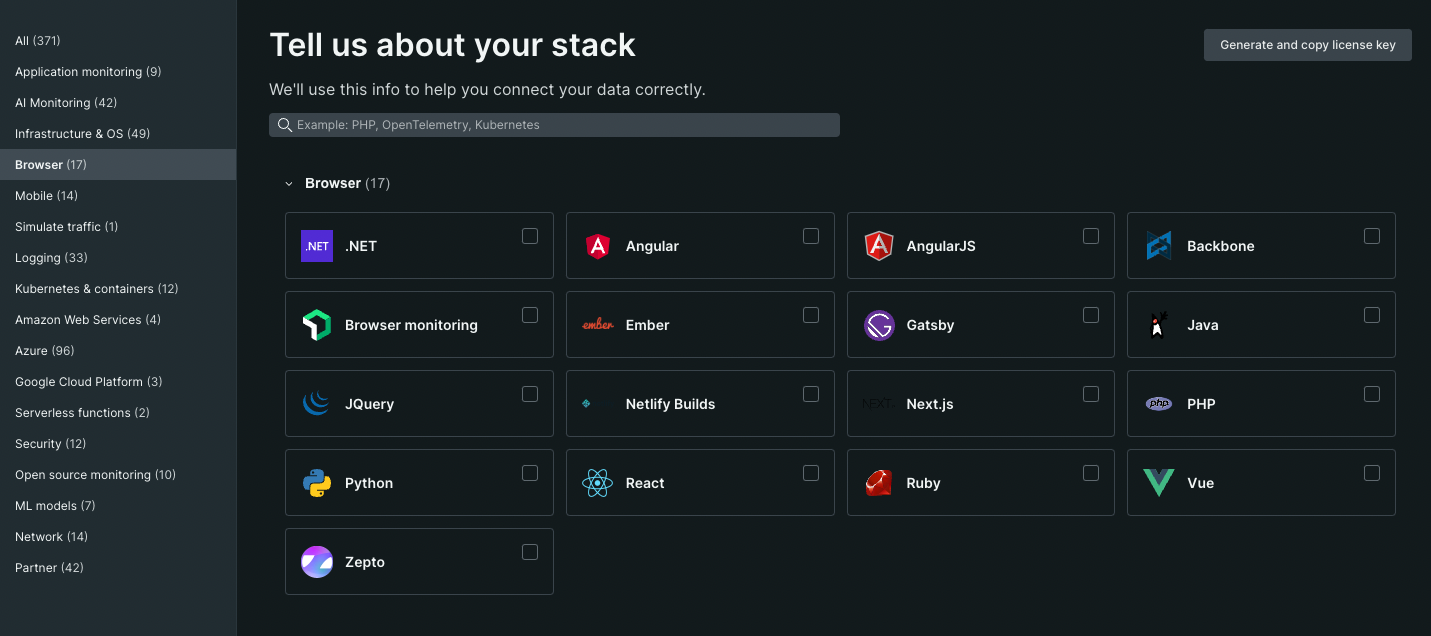
Select which environment to monitor. This time, select "Next.js" under "Browser".
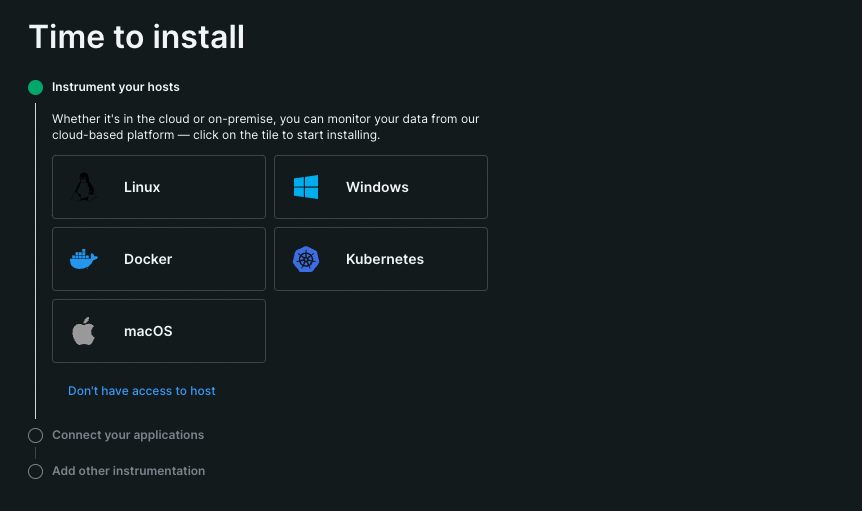
Since we are not monitoring the host side this time, select "Don't have access to host".
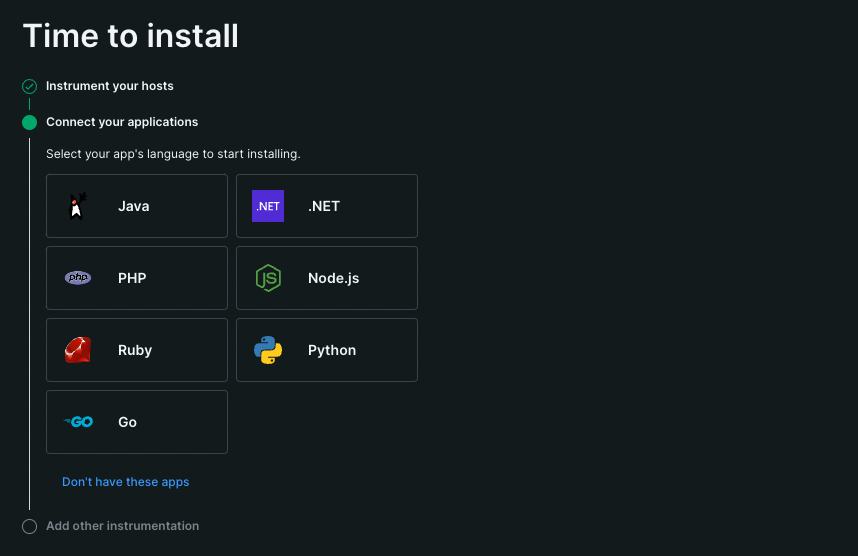
Proceed to the next step without selecting anything here.
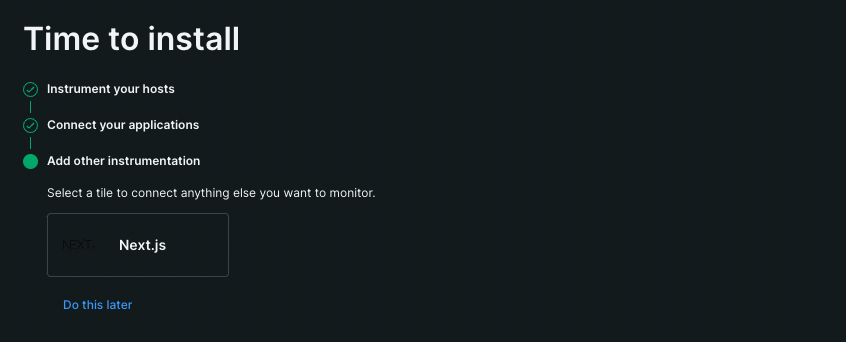
Select "Next.js" and proceed to the next step.
Select "Place a JavaScript snippet in frontend code".
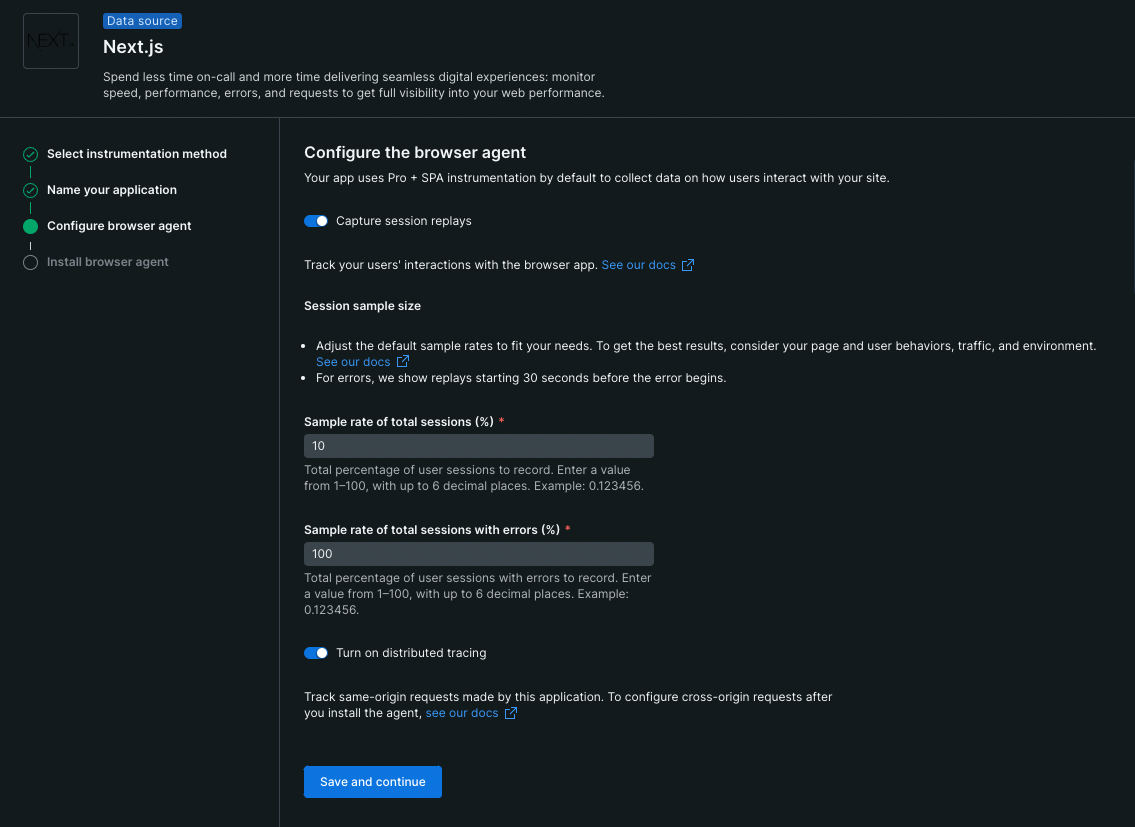
Decide on an application name. This time, we'll use "nextjs-tutorial".
For verification, check "Capture session replays" and "Turn on distributed tracing" and proceed.
A code snippet to run the Browser agent will be displayed, but we will set this up separately.
This completes the application setup.
Issuing a License Key
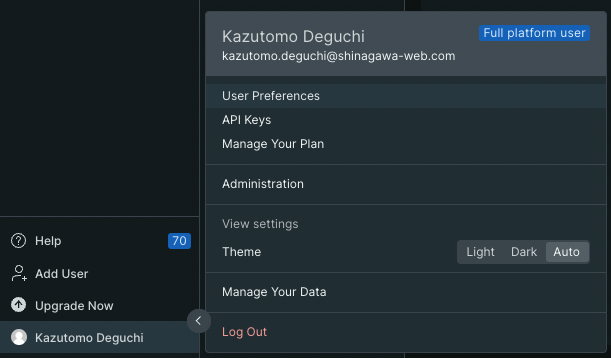
From the account name at the bottom left, select "API Keys".
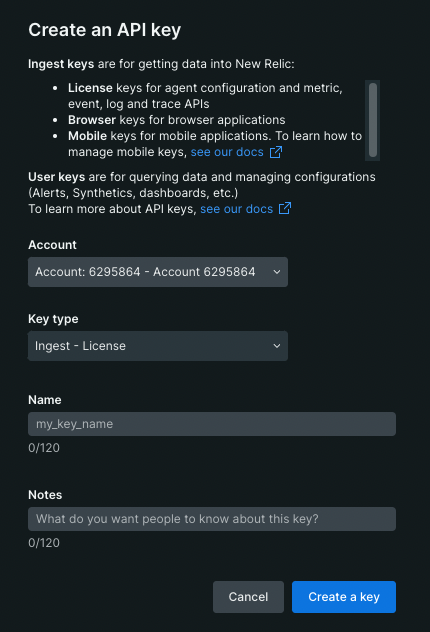
Select "Create a key".
Set the key type to "Ingest - License" and then select "Create a key" to issue a license key. Please make a note of it.
Next.js Setup
Creating a Next.js Project
First, create a Next.js project.
There are instructions here as well, so please refer to them.
If you follow these steps and can confirm that it runs in your local environment, you're done.
Installing the NPM Package
Install the New Relic package with the following command:
npm install newrelic
Then, to load the .env file, install the following package:
npm install dotenv
Editing next.config.js
To effectively measure your Next.js application with New Relic, you need to modify the next.config.js file.
This configuration ensures that modules supported by New Relic are not altered by webpack and are externalized.
Change your next.config.js file as follows:
'use strict'

const nrExternals = require('newrelic/load-externals')

module.exports = {
  experimental: {
    serverComponentsExternalPackages: ['newrelic']
  },
  webpack: (config) => {
    nrExternals(config)
    return config
  }
}
Creating the newrelic.js File
Create a newrelic.js file in the project root and configure the APM agent.
'use strict'

require('dotenv').config();

/**
 * New Relic agent configuration.
 *
 * See lib/config/default.js in the agent distribution for a more complete
 * description of configuration variables and their potential values.
 */
exports.config = {
  app_name: [process.env.NEW_RELIC_APP_NAME],
  license_key: process.env.NEW_RELIC_LICENSE_KEY,
  /**
   * This application_logging block shows the default configuration. That is,
   * it is not technically necessary; if it were omitted completely, we'd still
   * get the same configuration applied.
   *
   * We are including it here for illustrative purposes. With log forwarding
   * enabled, the Pino instance returned by `lib/logger.js` will be instrumented
   * by the `newrelic` agent and ship logs to New Relic so that they can be
   * viewed in the dashboard.
   */
  application_logging: {
    forwarding: {
      enabled: true
    }
  },

  logging: {
    /**
     * Level at which to log. 'trace' is most useful to New Relic when diagnosing
     * issues with the agent, 'info' and higher will impose the least overhead on
     * production applications.
     */
    level: 'trace'
  },

  /**
   * When true, all request headers except for those listed in attributes.exclude
   * will be captured for all traces, unless otherwise specified in a destination's
   * attributes include/exclude lists.
   */
  allow_all_headers: true,
  attributes: {
    /**
     * Prefix of attributes to exclude from all destinations. Allows * as wildcard
     * at end.
     *
     * NOTE: If excluding headers, they must be in camelCase form to be filtered.
     *
     * @name NEW_RELIC_ATTRIBUTES_EXCLUDE
     */
    exclude: [
      'request.headers.cookie',
      'request.headers.authorization',
      'request.headers.proxyAuthorization',
      'request.headers.setCookie*',
      'request.headers.x*',
      'response.headers.cookie',
      'response.headers.authorization',
      'response.headers.proxyAuthorization',
      'response.headers.setCookie*',
      'response.headers.x*'
    ]
  }
}
Explanation of the code:
require('dotenv').config();
This loads the .env file in the project root.
Next.js automatically loads .env, .env.local, etc., but since newrelic.js is loaded by Node.js, we use the dotenv package.
  app_name: [process.env.NEW_RELIC_APP_NAME],
  license_key: process.env.NEW_RELIC_LICENSE_KEY,
Set the application name and license key.
Since an application can be associated with multiple names, it is in array format.
Creating the .env File
Set environment variables so they can be accessed in newrelic.js.
NEW_RELIC_APP_NAME=xxxxxxx
NEW_RELIC_LICENSE_KEY=xxxxxxx
Editing package.json
Next, modify the scripts section of your package.json file.
Use Node's -r option to preload the newrelic module when running the application.
"scripts": {
  "dev": "NODE_OPTIONS='-r newrelic' next",
  "build": "next build",
  "start": "NODE_OPTIONS='-r newrelic' next start",
  "lint": "next lint"
}
Operation Check (Server Side)
Now that the server-side monitoring setup is complete, let's check if it works.
Start Next.js and access the top page.
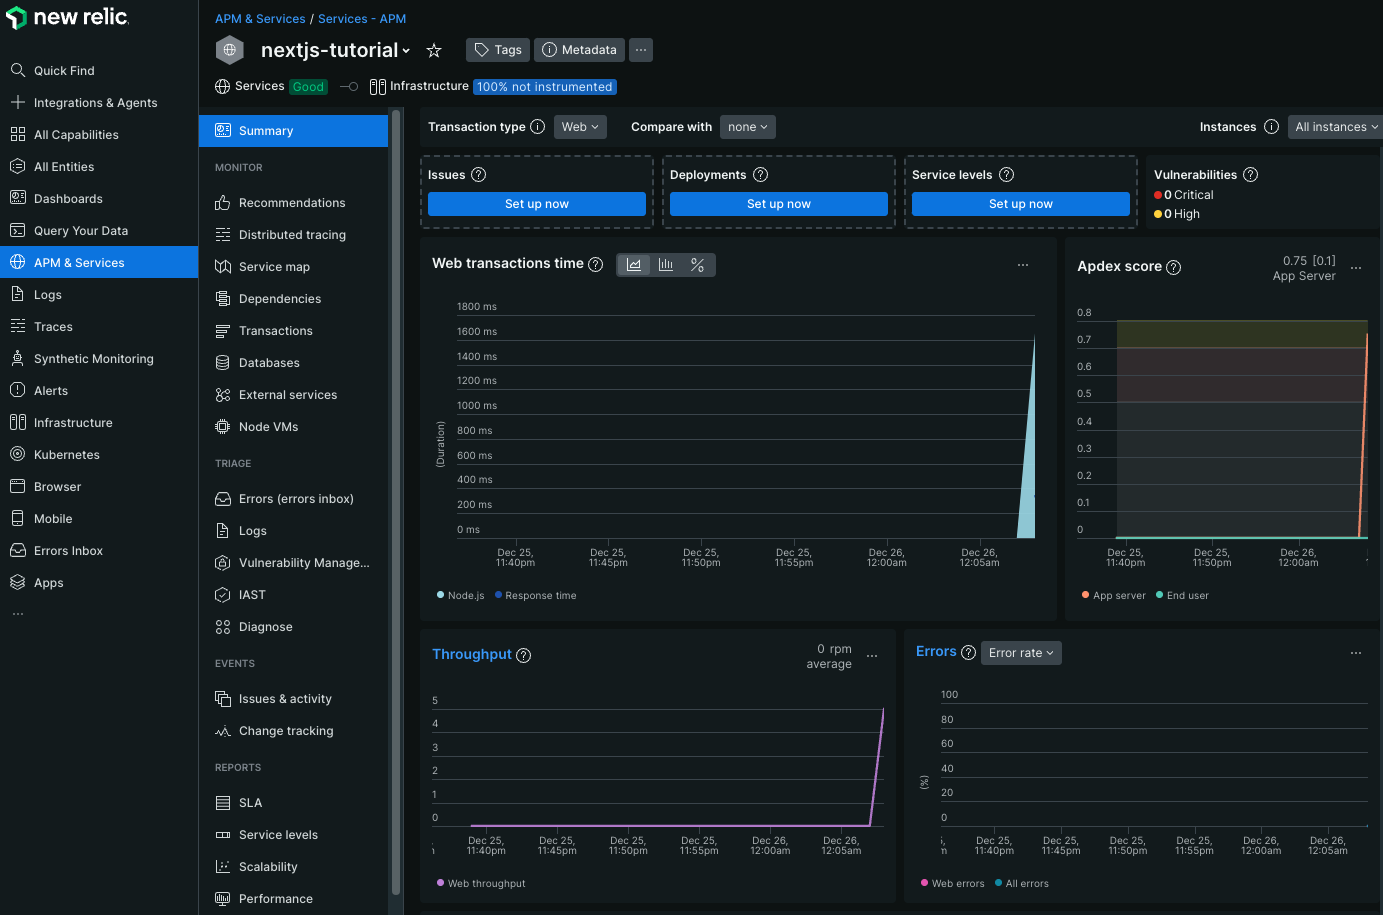
You will see logs output in New Relic's APM.
Next, let's check the logs when an error occurs in server-side processing.
First, write code to trigger an error.
Create a /app/api/error/route.ts file and write the following code:
export function GET() {
  throw new Error("API throw error test");
};
Once created, access the API to trigger the error.
You can access it by entering the following URL in your browser:
http://localhost:3000/api/error
Since this is server-side, the error message will be displayed in the console where you started the local server.
The error was triggered as expected.
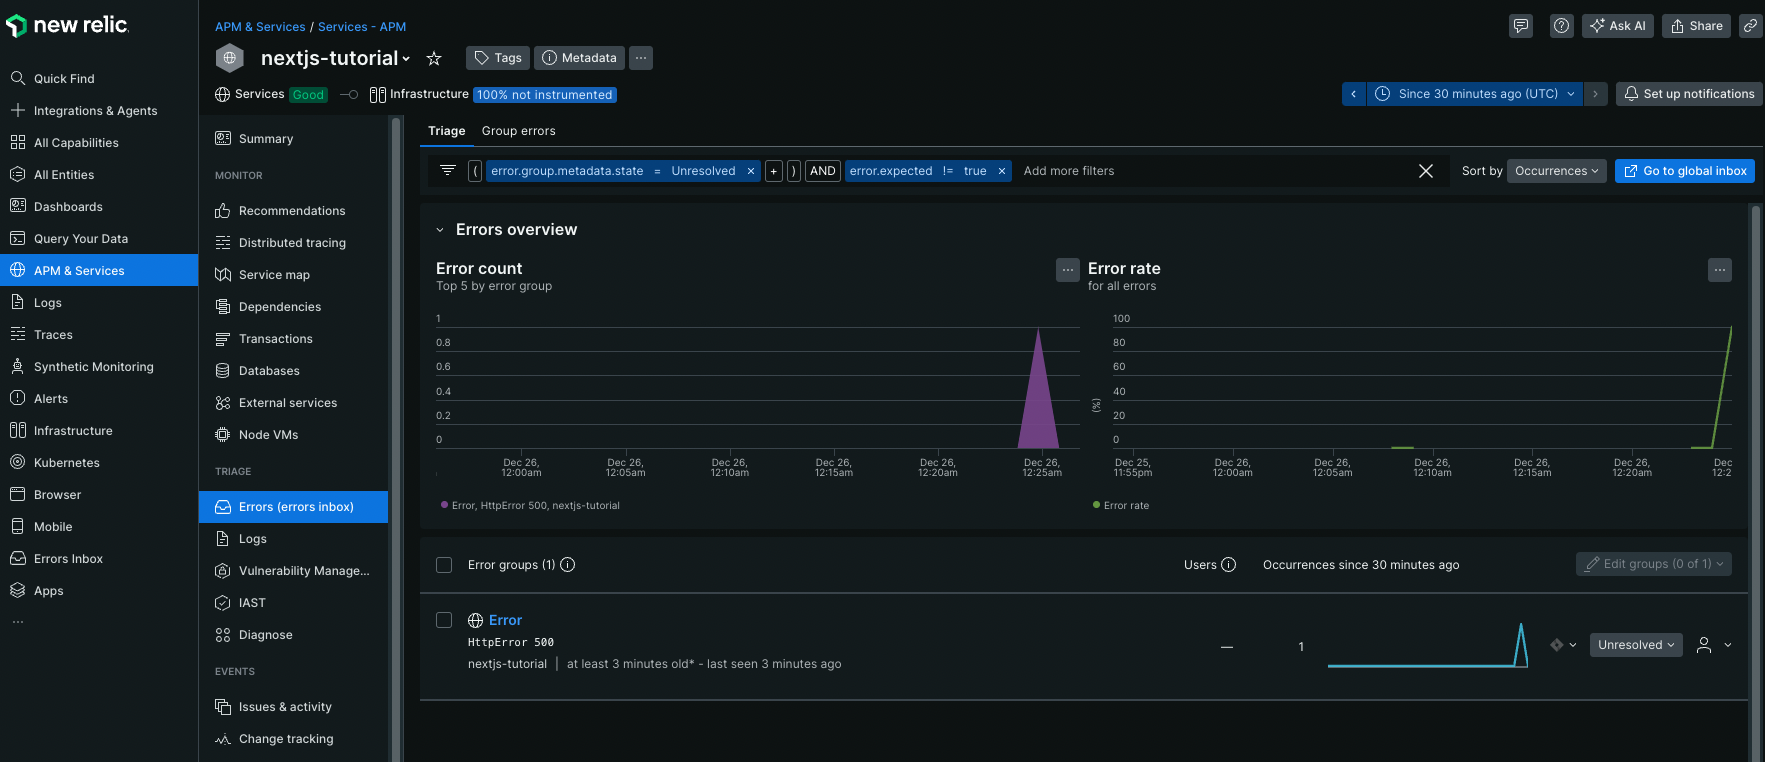
Check the New Relic dashboard to see if the error log was captured.
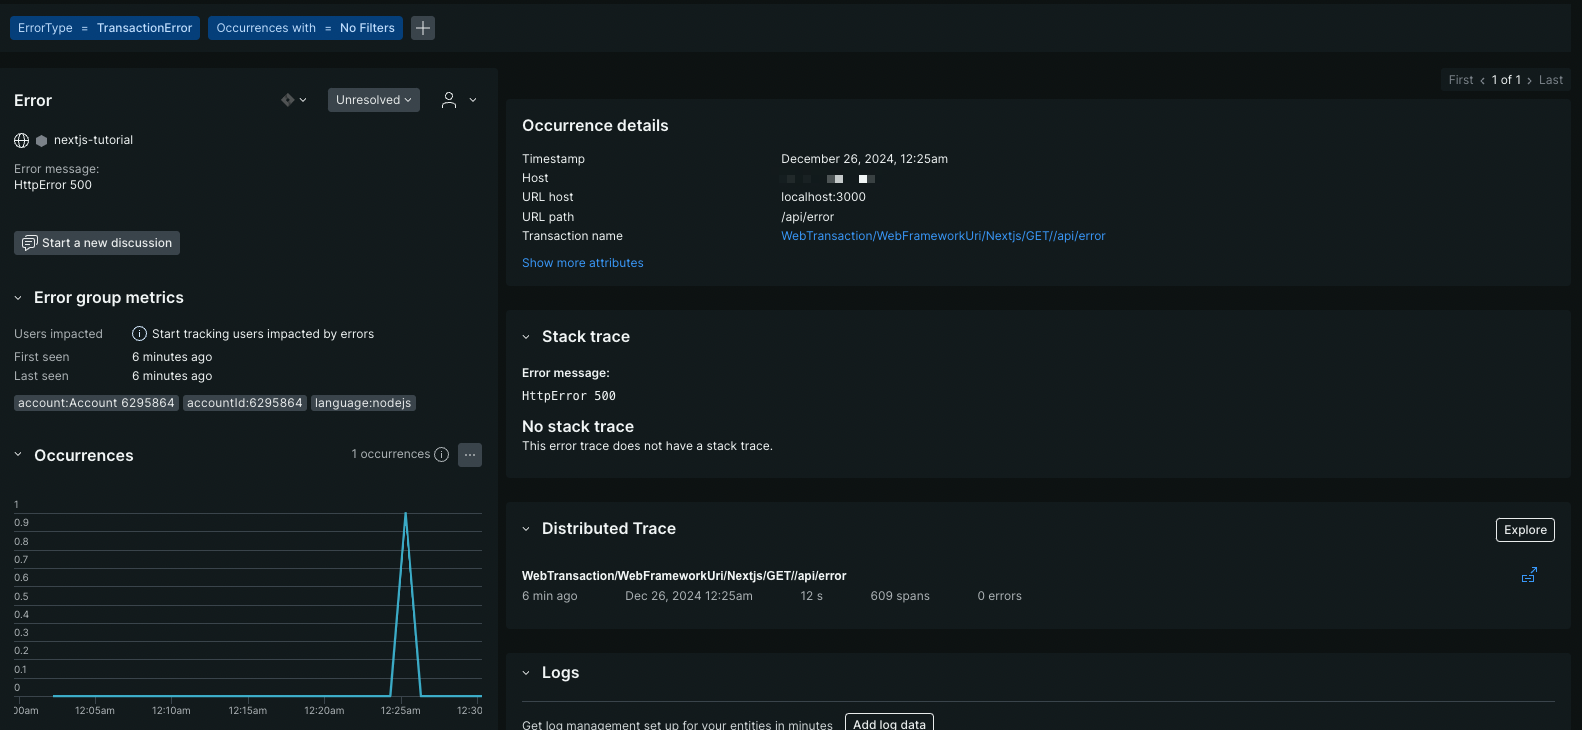
You can see that the error information was captured.
Clicking the "Error" link will show more details.
You can check the URL, occurrence time, and more.
Client-Side Monitoring Setup
We have confirmed that server-side monitoring is working with the previous setup.
For the client side, additional configuration is required.
Installing Type Definitions
Since we are using .tsx files, install the type definitions for newrelic in advance.
npm i --save-dev @types/newrelic
Change the /app/layout.tsx file to /app/layout.js and edit it as follows:
import Script from 'next/script'
import Link from 'next/link'
import newrelic from 'newrelic'

export default async function RootLayout({ children }) {
  if (newrelic.agent.collector.isConnected() === false) {
    await new Promise((resolve) => {
      newrelic.agent.on("connected", resolve)
    })
  }

  const browserTimingHeader = newrelic.getBrowserTimingHeader({
    hasToRemoveScriptWrapper: true,
    allowTransactionlessInjection: true,
  })

  return (
    <html>
	<Script
        id="nr-browser-agent"
        dangerouslySetInnerHTML={{ __html: browserTimingHeader }}
      />
      <body>
        <ul className="navbar">
          <li><a href="/">Home</a></li>
          <li><Link href="/users" key={"users"}>Users</Link></li>
          <li><Link href="/about" key={"about"}>About</Link></li>
        </ul>
        {children}
      </body>
    </html>
  )
}
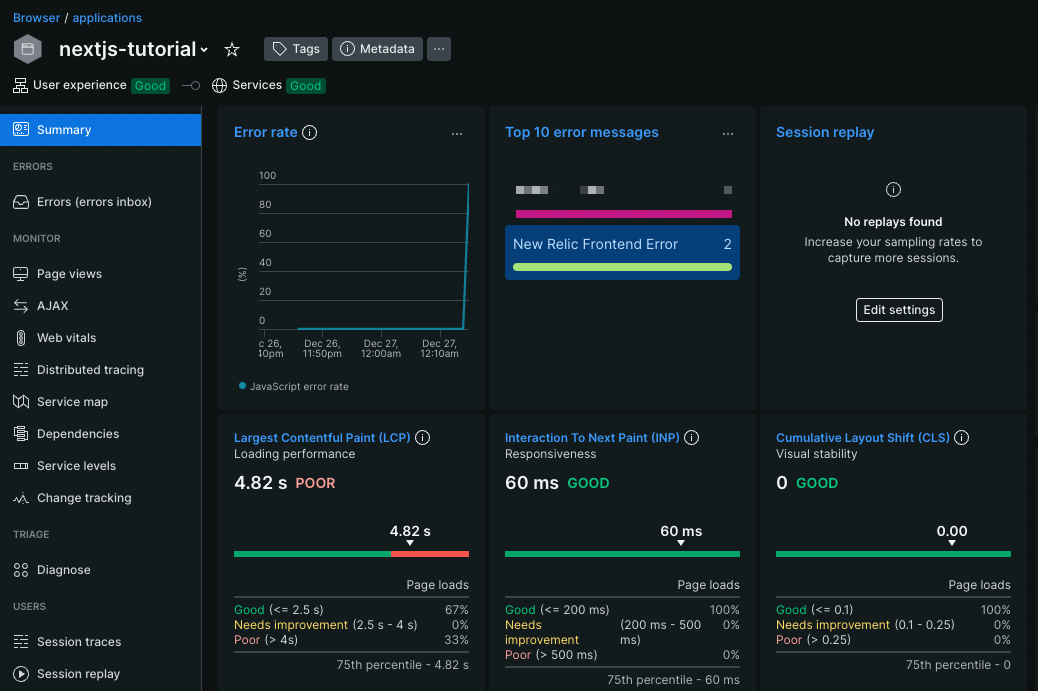
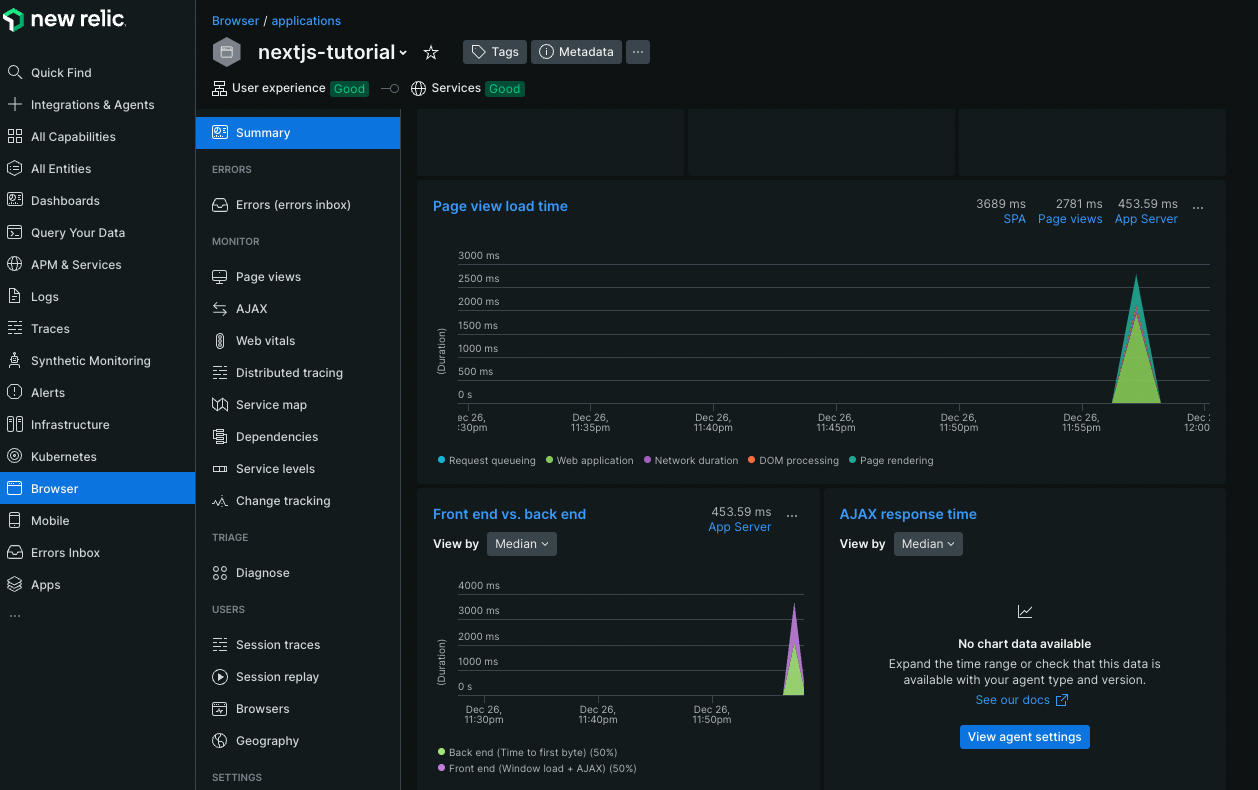
After editing the layout.js file, start Next.js and confirm that client-side logs are being output.
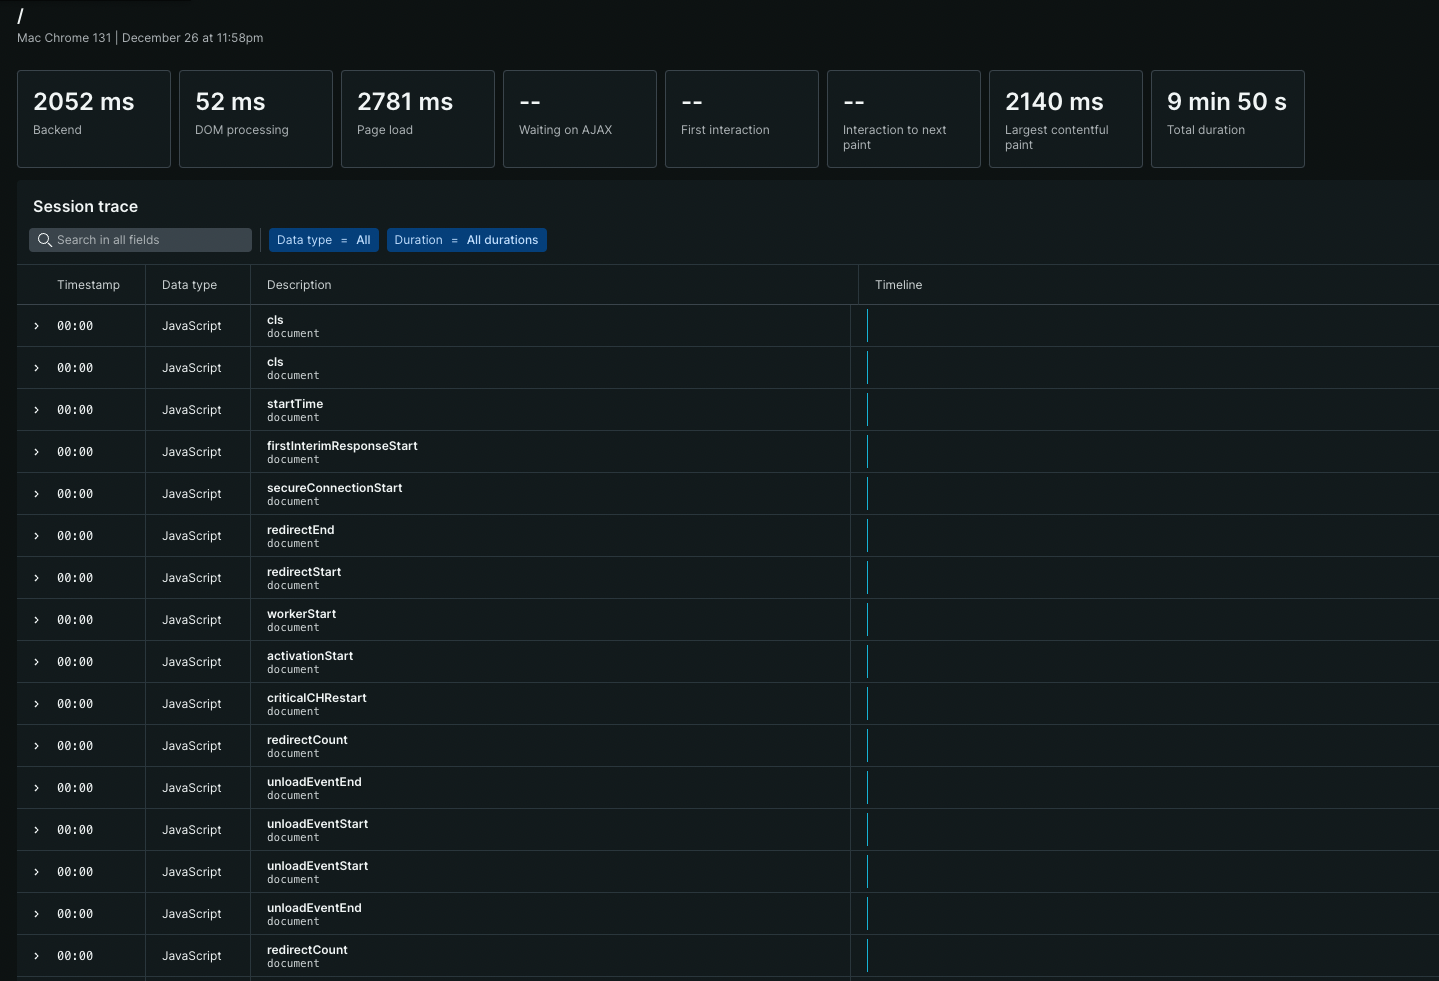
There is also a page where you can check the details of browser session processing.
Next, let's check if error logs occurring on the client side can be captured.
First, create a button component to trigger an error.
In /components/button.tsx, write the following:
'use client'
export const Button = () => {
  return (
    <button
      className="bg-blue-500 text-white font-bold py-2 px-4 rounded"
      type="button"
      onClick={() => {
        throw new Error("New Relic Frontend Error");
      }}
    >
      Throw error
    </button>
  );
}
Clicking this button will trigger an error and output the message "New Relic Frontend Error".
Next, create a page to use this component.
/app/test/page.tsx
import { Button } from "@/components/button"

const TestPage = () => {
  return (
    <div>
      <h1>
        Test Page
      </h1>
      <Button />
    </div>
  )
}

export default TestPage
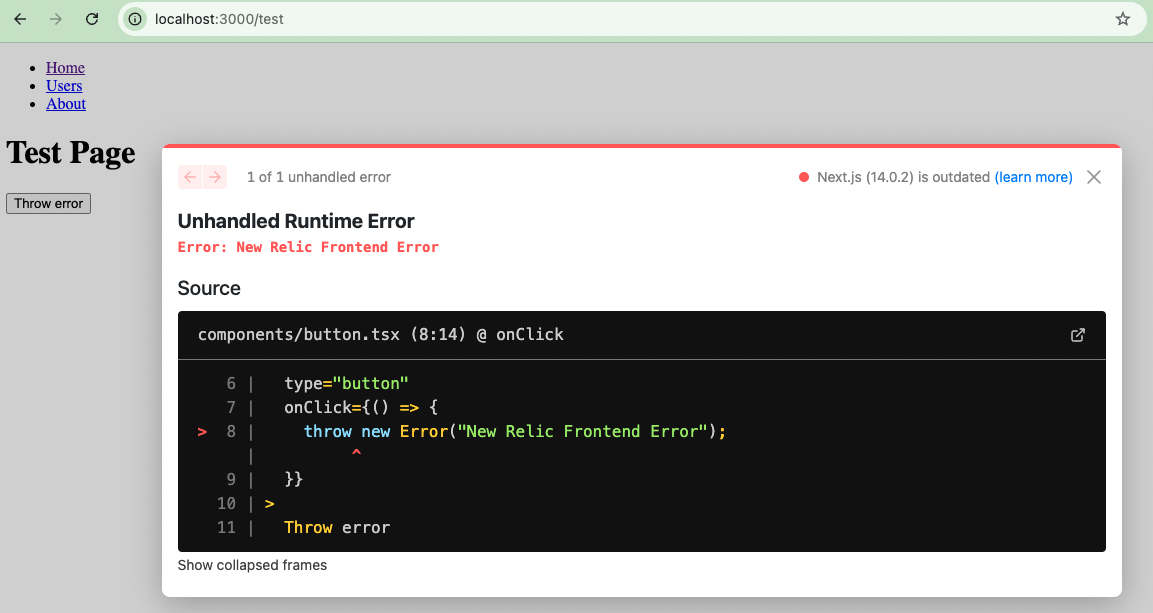
Once created, access the page and click the button.
If an error occurs as shown below, it's OK.
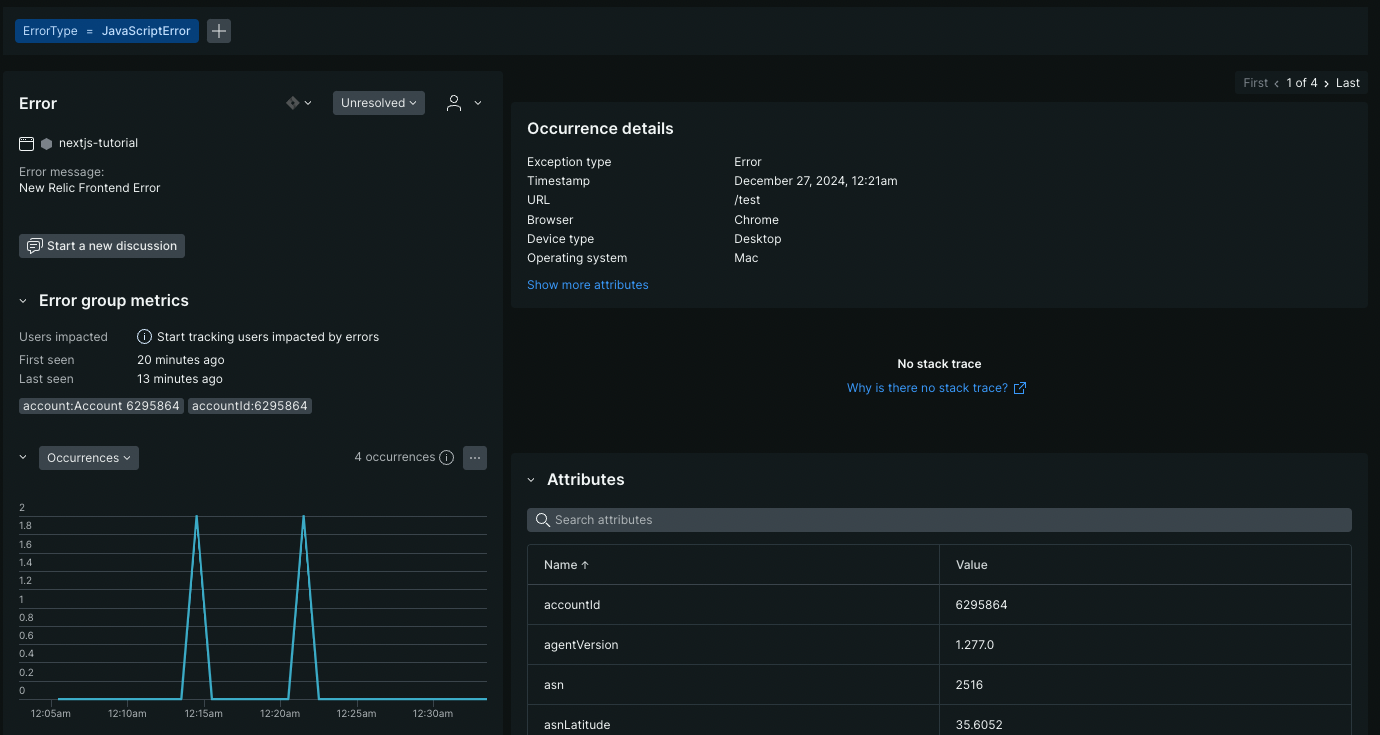
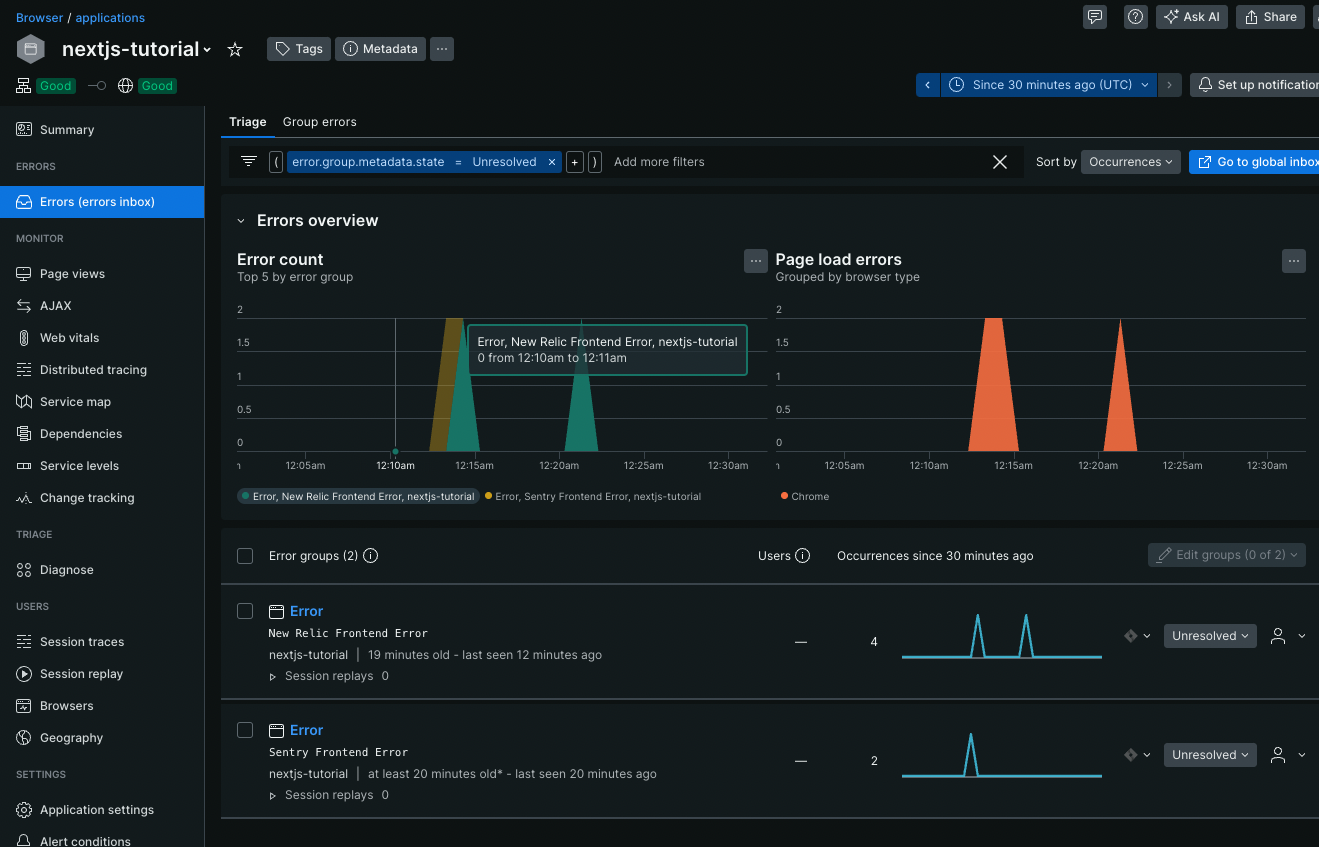
You can then confirm that New Relic has detected the error.
This is a dedicated error dashboard.
New Relic groups and displays errors.
You can also view more detailed information, such as the accessed URL, occurrence date and time, browser, and OS, making investigation smoother for developers.
Conclusion
In this article, we introduced the steps to set up New Relic in a Next.js application and perform performance monitoring. New Relic is a very powerful tool for visualizing application and infrastructure performance and quickly identifying the root cause of issues. Its multifunctionality and ease of use are especially attractive for operating increasingly complex modern applications.
Please refer to the content introduced in this article and try using New Relic in your own projects. The setup is relatively simple, and the benefits are significant. It is especially recommended for those who are facing performance issues or aiming to streamline operations.
Thank you for reading to the end! I hope this article helps improve the quality of your applications. If you have any questions or concerns, please feel free to leave a comment or feedback.
Questions about this article 📝
If you have any questions or feedback about the content, please feel free to contact us.Go to inquiry form
Related Articles
How to Integrate Sentry into a Next.js Project for Error Monitoring and Performance Tracking
2025/01/03Chat App (with Image/PDF Sending and Video Call Features)
2024/07/15Practical Component Design Guide with React × Tailwind CSS × Emotion: The Optimal Approach to Design Systems, State Management, and Reusability
2024/11/22Management Dashboard Features (Graph Display, Data Import)
2024/06/02Tutorial for Implementing Authentication with Next.js and Auth.js
2024/09/13Thorough Comparison of the Best ORMs for the Next.js App Router: How to Choose Between Prisma / Drizzle / Kysely / TypeORM [Part 1]
2025/03/13Test Strategy in the Next.js App Router Era: Development Confidence Backed by Jest, RTL, and Playwright
2025/04/22Done in 10 minutes. Easy deployment procedure for a Next.js app using the official AWS Amplify template
2024/11/05


