How to Integrate Sentry into a Next.js Project for Error Monitoring and Performance Tracking
This post is also available in .
Introduction
I picked up Sentry as a monitoring tool for Next.js and summarized how to introduce a monitoring mechanism.
Since Next.js runs programs on both the client side and the server side, we’ll verify behavior while taking that into account.
Monitoring is not limited to error logs; you can also check performance, so I’ll also show what kind of information you can see for each.
Goal for This Article
We will add Sentry’s NPM package to a Next.js project.
After that, we’ll make it possible to view errors that occur on the server side in Sentry.
You can also capture errors that occur on the client side,
and for processes where the response takes time, you can obtain detailed information such as which part is taking time.
About Sentry
Sentry is a service for application error monitoring and performance monitoring. It is mainly provided for developers and is very popular as a tool that detects errors and performance issues in real time and helps you respond quickly.
Main Features and Capabilities
- Error Tracking (Error Monitoring)
- Captures errors that occur in your application and reports in detail where they occurred.
- Collects stack traces and related metadata (user information, request details, etc.) to make it easier to identify issues.
- You can receive notifications when errors occur (integrates with email, Slack, PagerDuty, etc.).
- Performance Monitoring
- Visualizes application performance (response time, throughput, API call bottlenecks, etc.).
- Collects detailed data for each request and transaction, making it easier to pinpoint the cause of latency.
- Real-Time Monitoring
- Lets you immediately discover issues in deployed code and minimize impact on users.
- Multi-language & Multi-framework Support
- Supports a wide range of tech stacks, including frontend (JavaScript, React, Vue, etc.), backend (Node.js, Python, Ruby, Java, Go, etc.), and mobile (iOS, Android).
- Integrations and Customization
- Integrates with GitHub and GitLab so you can track which commit introduced an error.
- Allows you to add custom tags and context for deeper analysis of error conditions.
- Release Management
- Tracks errors and performance data per release so you can see whether issues are occurring in new versions.
Use Cases
- Immediate error awareness: Fix issues before they affect users.
- Performance optimization: Identify and improve response times and bottlenecks.
- Post-deploy stability checks: Monitor what impact a release has had.
Benefits
- Helps developers fix issues quickly, contributing to better user experience.
- Enables teams to share error and performance data for efficient debugging.
- Reduces the tedious work of checking logs and shortens the time needed to identify problems.
Creating a Next.js Project
First, create a Next.js project.
The creation steps are also described here, so please refer to this as needed.
Once you've followed these steps and confirmed that the app can start in your local environment, you're done.
Registering a Sentry Account
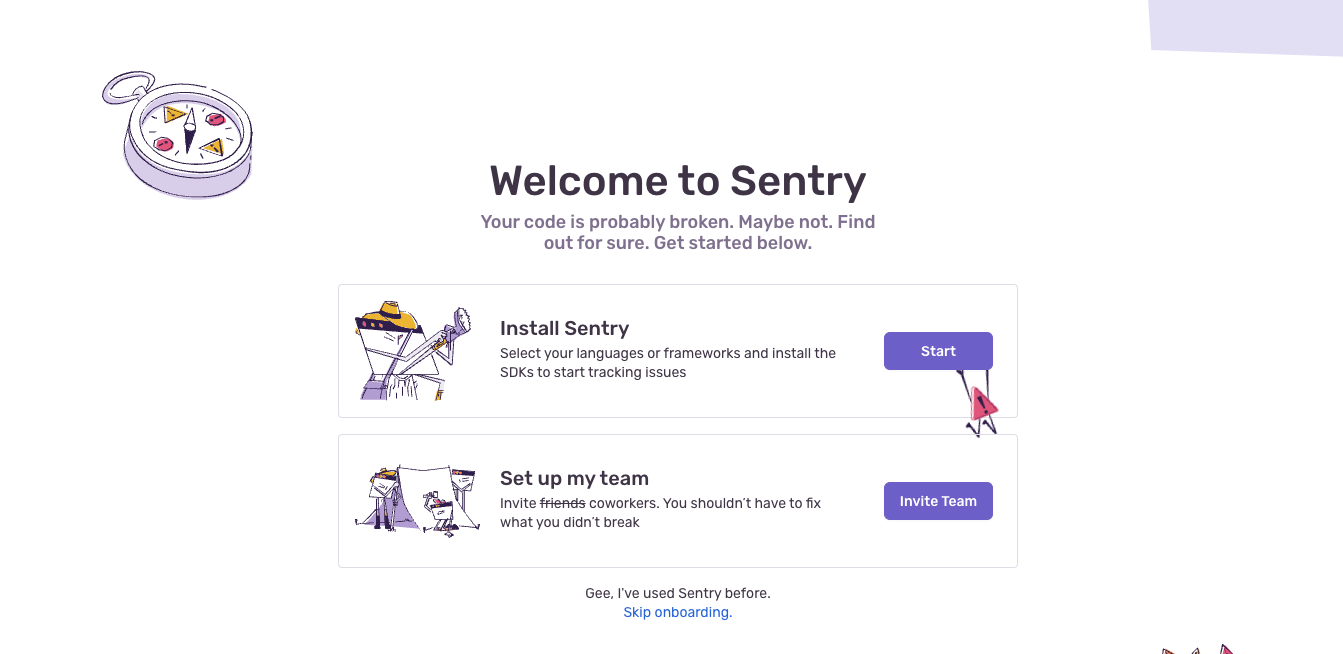
Now let’s register an account with Sentry and get it ready to use.
If you’re using it alone as a developer, it’s free, so no worries.
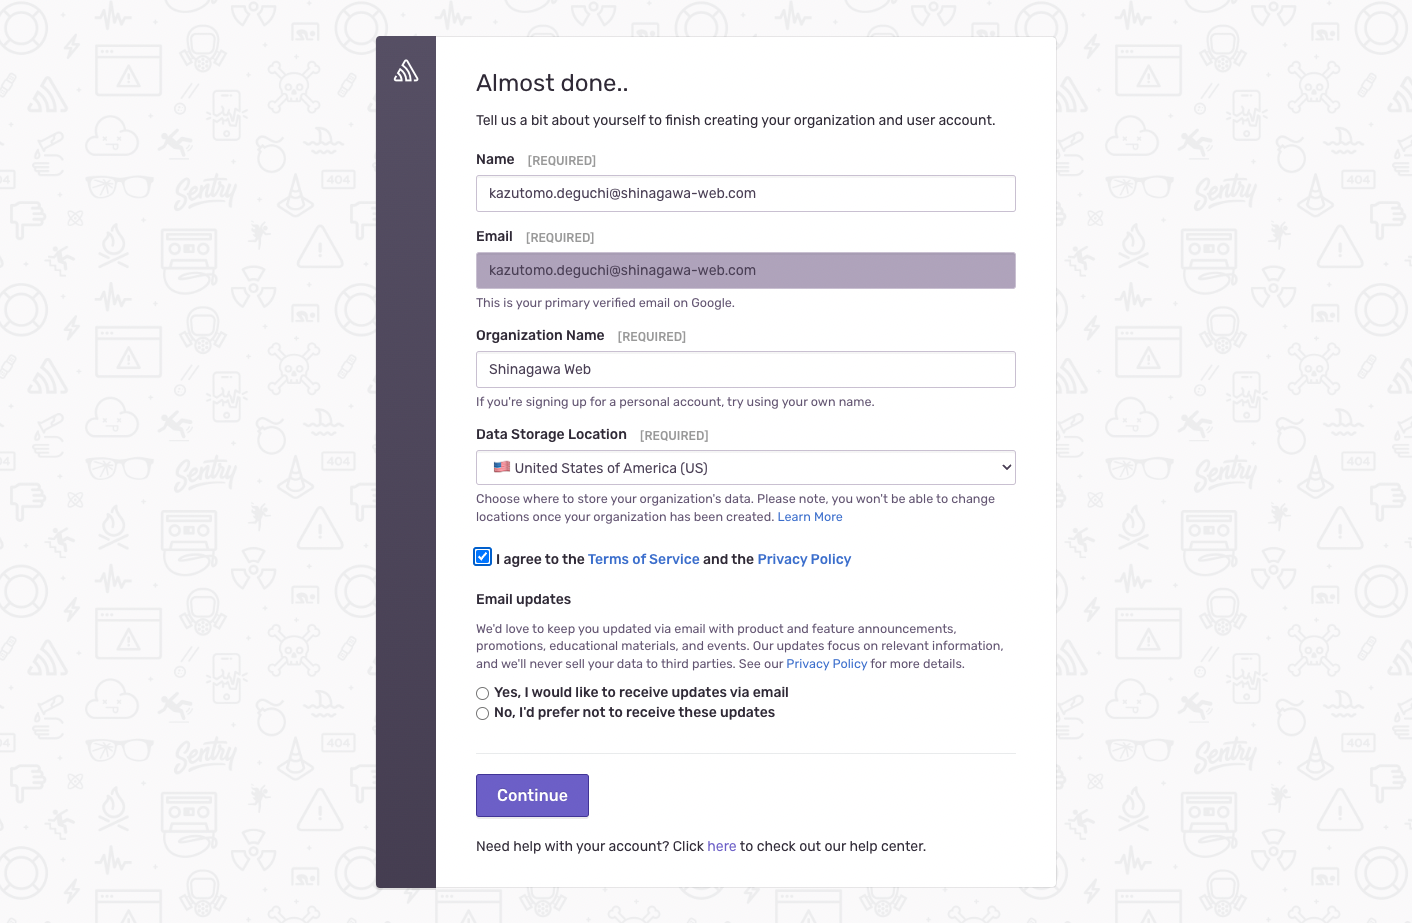
For signup, enter your name, email address, and organization name.
Then choose the location where monitoring results will be stored. It’s either US or EU, so either is fine.
Once registration is complete, we’ll immediately set up Sentry in the local environment.
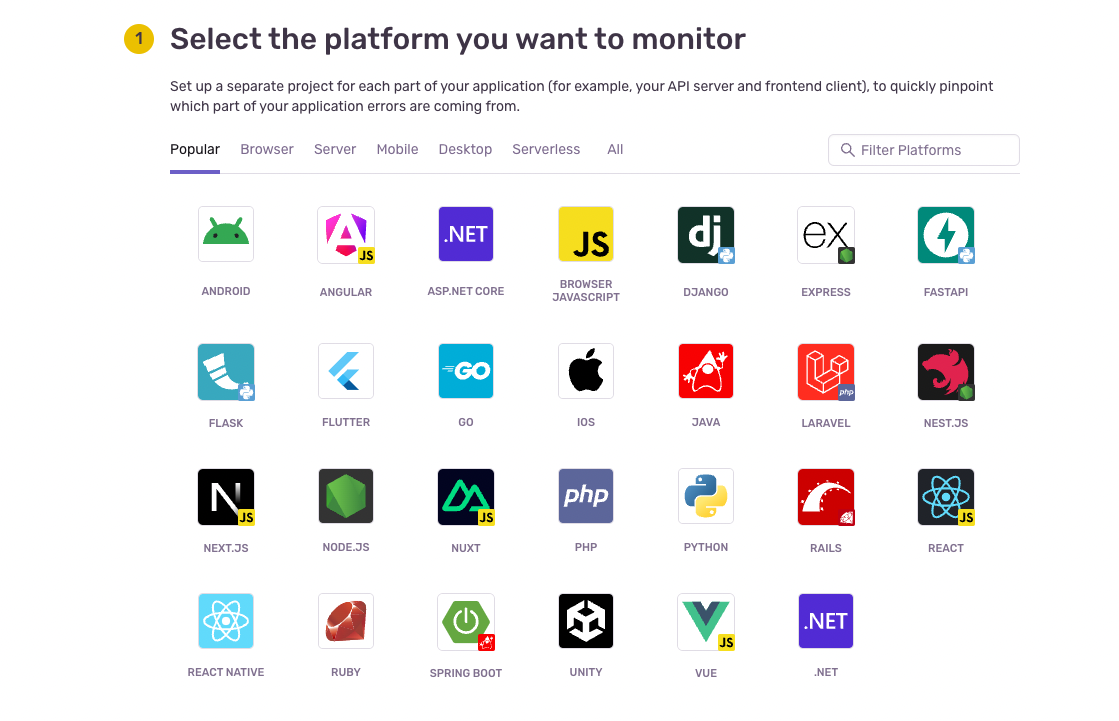
As mentioned earlier in the main features and capabilities, Sentry supports various languages and frameworks; this time we’ll choose “Next.js”.
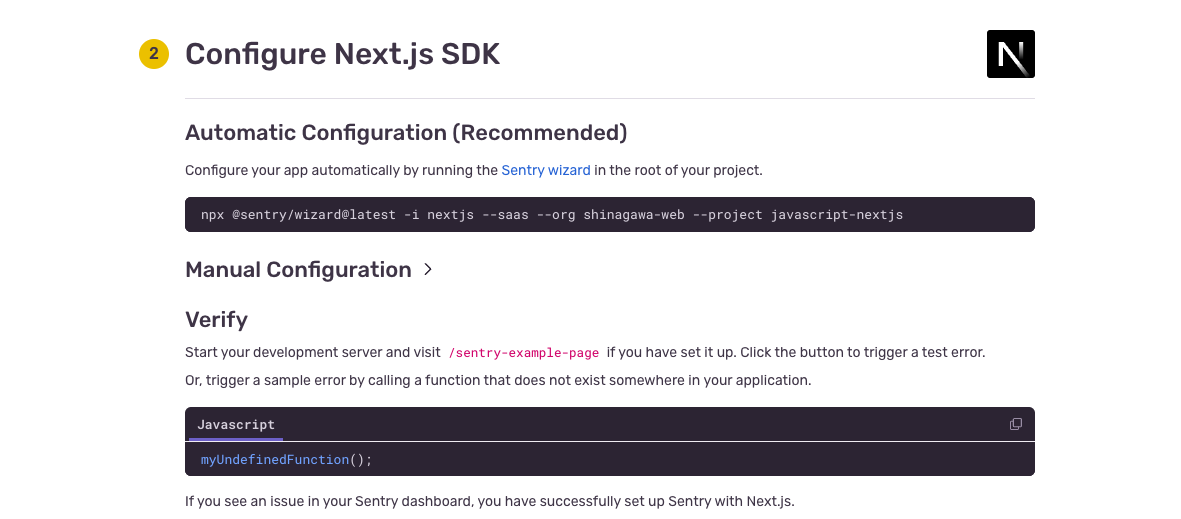
Then you’ll see the command to install Sentry into your Next.js project.
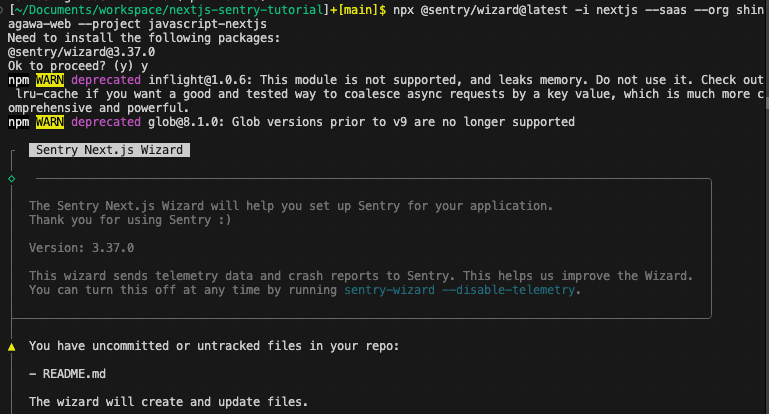
Copy it and run it.
In my case, I had uncommitted files left, so I got a warning.
Ignore it and continue.
Do you have a Sentry account? → Yes
Then the command prompt will access Sentry and perform authentication.
Once authenticated, it will install the packages and proceed.
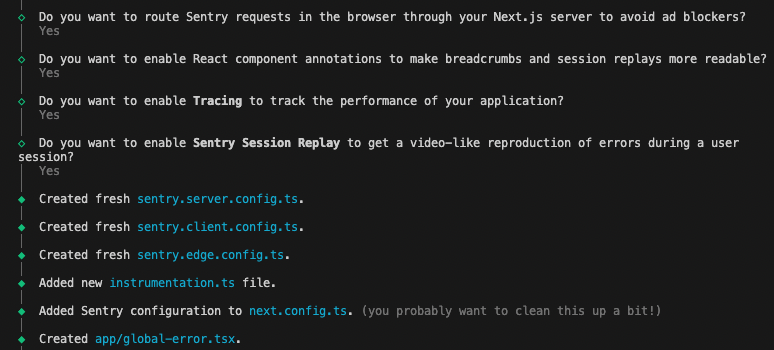
You’ll get four questions about the setup.
First Question
Do you want to route Sentry requests in the browser through your Next.js server to avoid ad blockers?
This asks whether to send error reports that occur in the browser directly to Sentry, or to send them via the Next.js server first.
Benefits of sending via the server:
- Less likely to be blocked by ad blockers like AdBlock, so error reports are more reliably sent.
- User IP addresses and similar data are not sent directly to Sentry (potentially stronger privacy protection).
However, concerns include:
- Increased server load.
- Higher hosting costs if there are many sends.
Since this is just a test, we’ll choose “send via the server” (Yes).
Second Question
Do you want to enable React component annotations to make breadcrumbs and session replays more readable?
“Do you want to enable React component annotations? Enabling this makes Sentry’s breadcrumbs and session replays easier to read and understand.”
This message is about a configuration option when integrating Sentry into a React app.
Meaning:
“Do you want to enable React component annotations? If enabled, Sentry’s breadcrumbs and session replays will be more readable and easier to understand.”
What are React Component Annotations?
- When Sentry captures an error, it can include React component names and hierarchy in the error log, making it easier to see which component had the problem.
- Breadcrumbs: A feature that records user action history and events (clicks, navigation, etc.). It can clearly show which React component each action occurred in.
- Session Replays: A feature that records and replays user sessions. Including React component information in the replay makes it easier to see where actions occurred.
Since this makes debugging easier, choose “Yes”.
Third Question
Do you want to enable Tracing to track the performance of your application?
Do you want to enable the Tracing feature in Sentry?
Benefits of enabling it include:
- Identifying performance bottlenecks: For example, quickly finding answers to “Where is page load slow?” or “What’s causing this API call to be slow?”
- Improving user experience: Understanding how the app behaves and fixing problem areas leads to better UX.
- Tracking both frontend and backend: You can trace not only the frontend (React, Next.js) but also APIs and databases on the backend.
- Linking errors and performance: Visualize which requests or transactions are affected by errors.
Tracing data is often larger in volume than logs, which can increase Sentry usage costs, but since this is a test, we’ll choose “Yes”.
Fourth Question
Do you want to enable Sentry Session Replay to get a video-like reproduction of errors during a user
session?
Do you want to enable the Sentry Session Replay feature?
It’s somewhat similar to the second question, but again, since this is a test, we’ll choose “Yes”.
The questions continue.
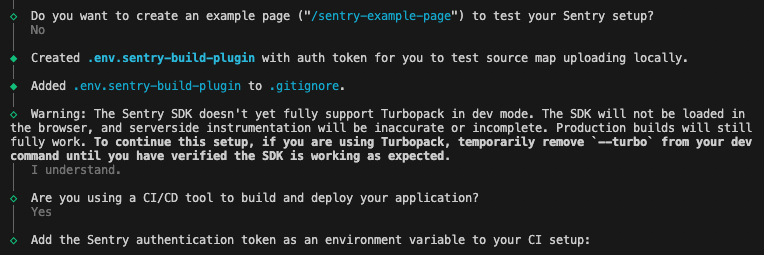
You’ll be asked whether to create a sample page; choose “No”.
There are two reasons: first, there is a known bug related to this process.
(It seems to have been resolved now, though...)
The other reason is that Sentry’s official tutorial provides sample code that you can use for behavior verification.
After setting “No”, more questions follow.
Warning: The Sentry SDK doesn't yet fully support Turbopack in dev mode. ...
Turbopack was released as stable in Next.js 15, but it seems Sentry doesn’t support it yet.
We’ll later change the settings so Turbopack is not used.
Are you using a CI/CD tool to build and deploy your application ?
Choose “Yes” here as well.
Then SENTRY_AUTH_TOKEN will be displayed on the screen.
Copy that value, create .env.development.local, and paste it in.
SENTRY_AUTH_TOKEN=xxxxxxxx
Next, change the Turbopack setting for Next.js 15 that was warned about earlier.
  "scripts": {
-     "dev": "next dev --turbopack",
+     "dev": "next dev",
    "build": "next build",
    "start": "next start",
    "lint": "next lint"
  },
Checking the Sentry Dashboard
Sentry is convenient in that it lets you go from account registration to local environment setup in one go.
Because of that, we haven’t checked the dashboard yet.
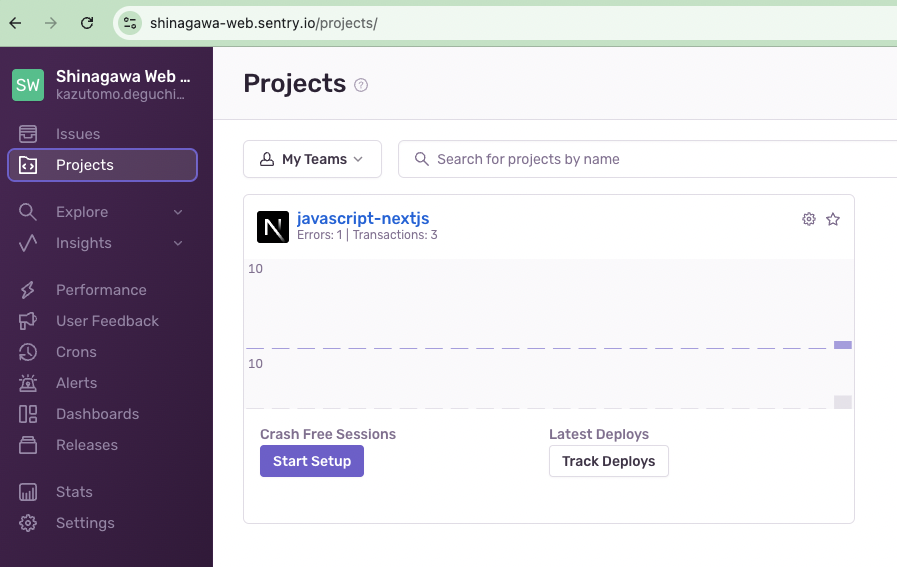
Let’s check the dashboard first.
A list of projects will be displayed; select your project.
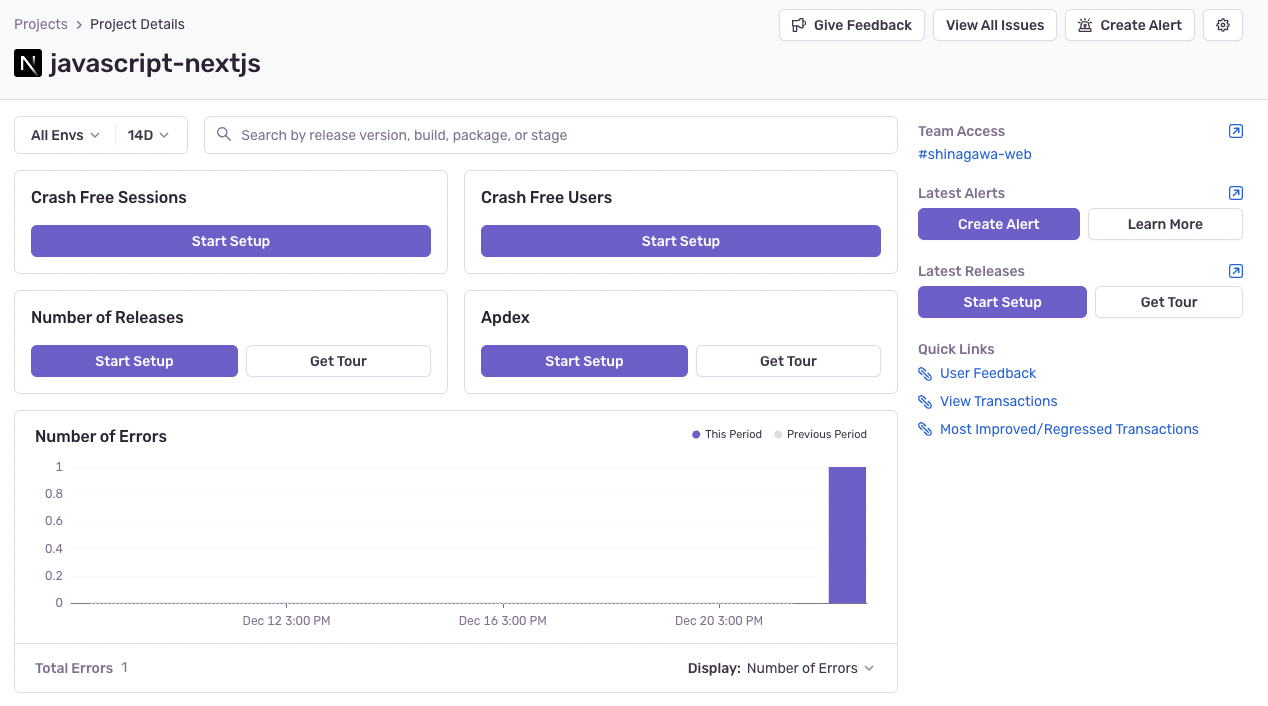
In my environment, I already triggered one error, so it’s already shown on the graph...
Behavior Verification
Now that Sentry setup is complete in the Next.js project, we’ll actually trigger errors and check whether logs are being sent to Sentry.
Client-Side Behavior Verification
Create a component to trigger an error as components/button.tsx.
We’ll follow Sentry’s official tutorial.
export const Button = () => {
  return (
    <button
      type="button"
      onClick={() => {
        throw new Error("Sentry Frontend Error");
      }}
    >
      Throw error
    </button>
  );
}
Make the top page call the component you just created.
When you first create a Next.js project, it contains sample code, so delete that and write the following code.
import { Button } from "@/components/button";

export default function Home() {
  return (
   <div>
      <h1>Home</h1>
      <Button />
   </div>
  );
}
Start Next.js and click the button labeled “Throw error”.
An error should appear; then check the dashboard.
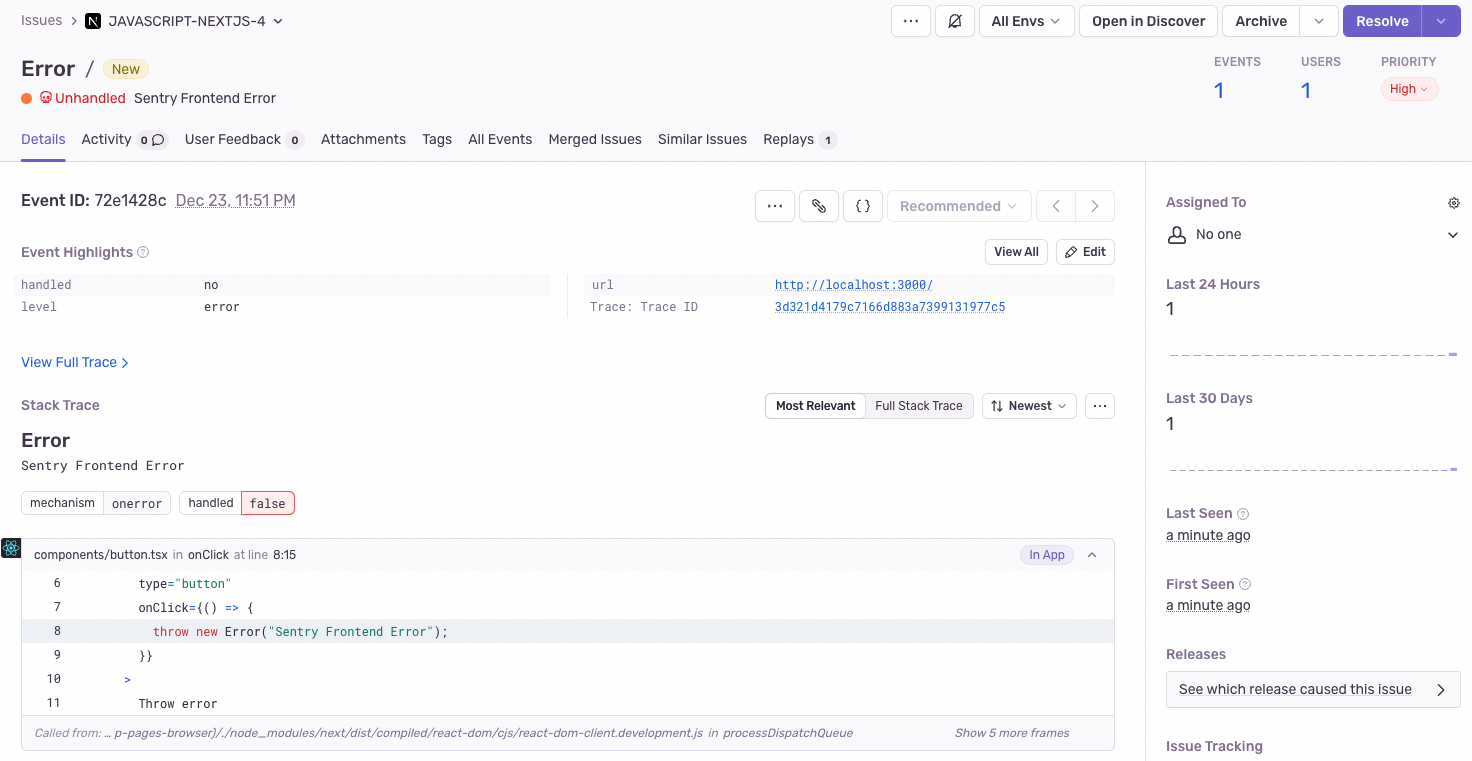
There is one error.
It’s labeled Sentry Frontend Error. Click it to see the details.
You can see the time the error occurred (UTC), the URL, and so on.
You can also see the relevant code where the error occurred.
You can see that the error occurred at throw new Error in the component we created earlier.
Knowing the code where the error occurred makes investigation much smoother for developers.
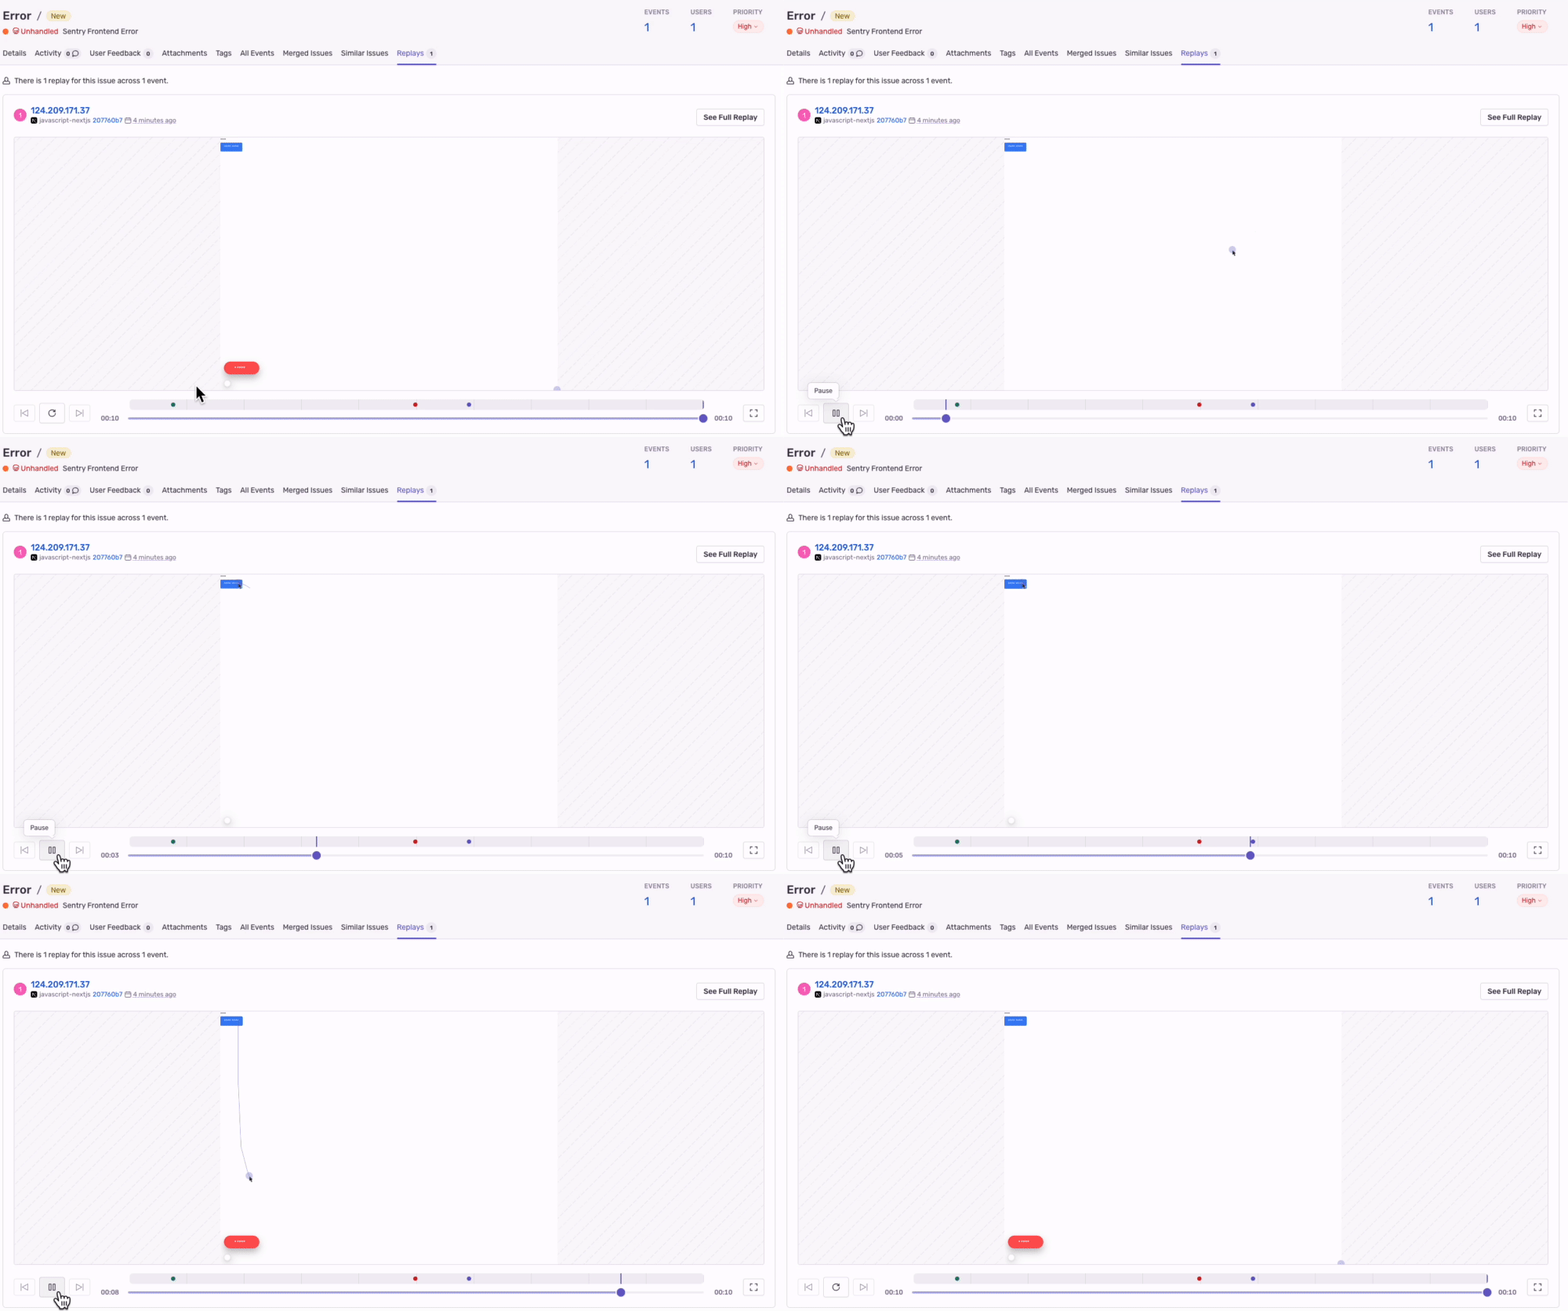
On the error details screen above, click the Replays tab to view client-side actions as a video.
You can see how the user triggered the error, which is a very convenient feature that makes investigation much smoother.
Server-Side Behavior Verification
Next, we’ll check logs for errors that occur in server-side code.
First, write code that triggers an error.
Create /app/api/error/route.ts and write the following code.
export function GET() {
  throw new Error("API throw error test");
};
Once created, access the API to trigger the error.
You can access it by entering the following URL in your browser:
http://localhost:3000/api/error
Since this is server-side, the error message will appear in the console where you started the local server.
We were able to trigger the error as expected.
Check the Sentry dashboard to see whether the error log was captured.
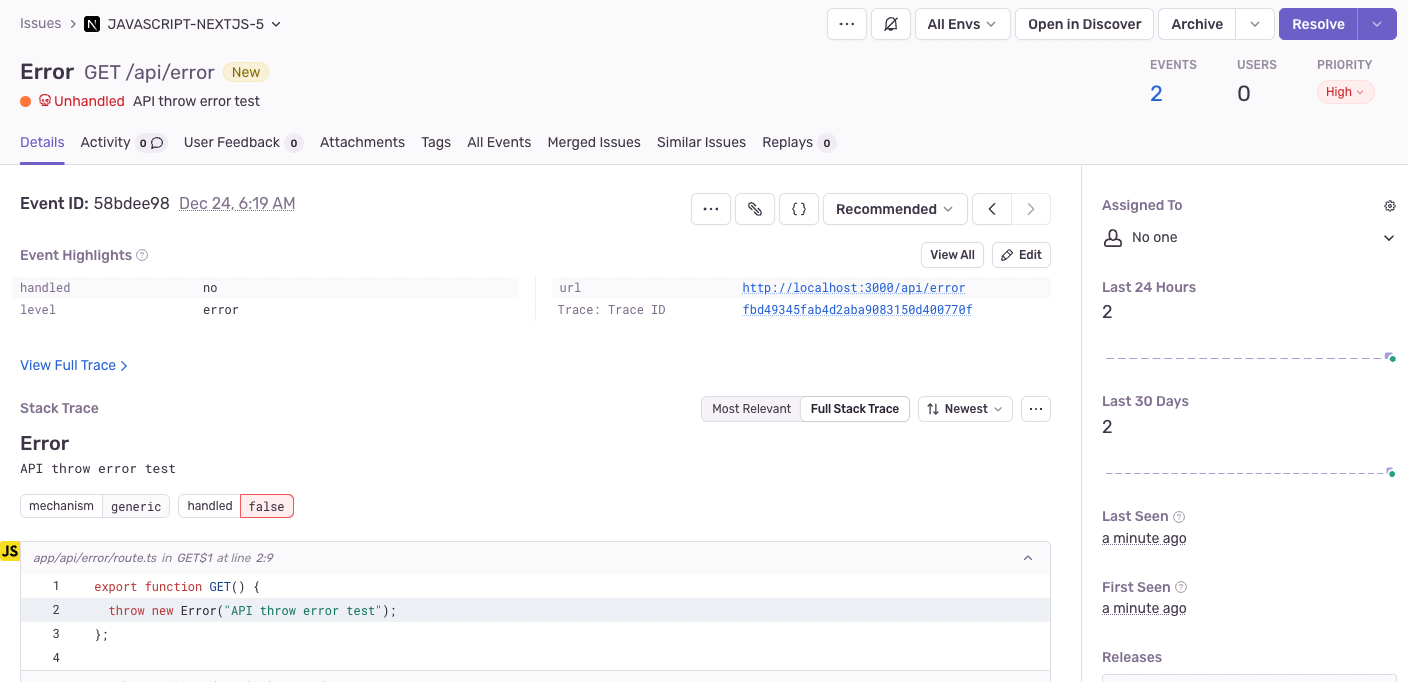
We can confirm that an error called API throw error test occurred.
Click the link to see the details.
You can see the error occurrence time and URL.
You can also see which code the error occurred in.
You can confirm that the error occurred in the file we created earlier.
Performance Behavior Verification
Sentry lets you check various information about performance as well as errors.
We’ll prepare a page that takes time to display and test it.
Create /app/slow/page.tsx and write the following code.
export default async function SlowPage() {
  await new Promise((resolve) => setTimeout(resolve, 3000))
  return (
    <div>
      <h1>Slow Page</h1>
    </div>
  );
}
We configured it to sleep for 3 seconds on the server side before rendering.
When you access
http://localhost:3000/slow
the page should appear after a short delay.
You can view information from Performance in the left menu.
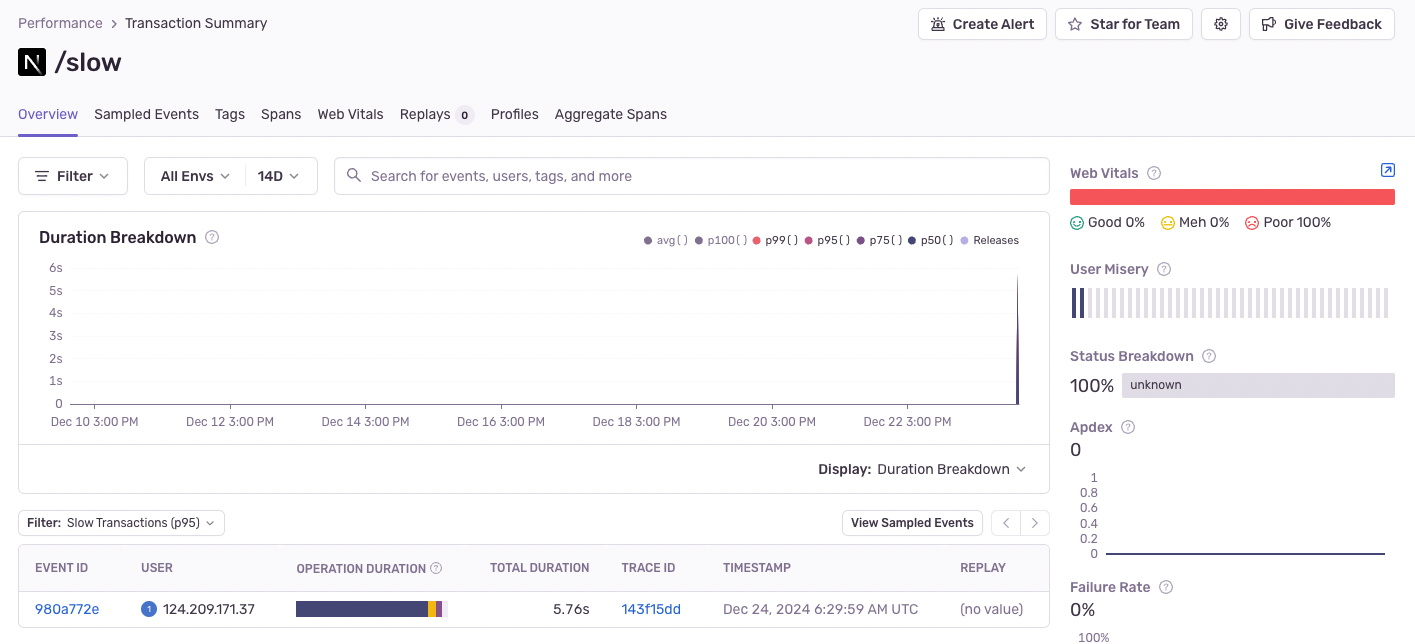
A transaction called /slow will be displayed. You can see that it took about 5 seconds to display.
Click it to see the details.
(It may take a little time for the logs to appear.)
We only accessed it once, so there is one row.
Click TRACE ID.
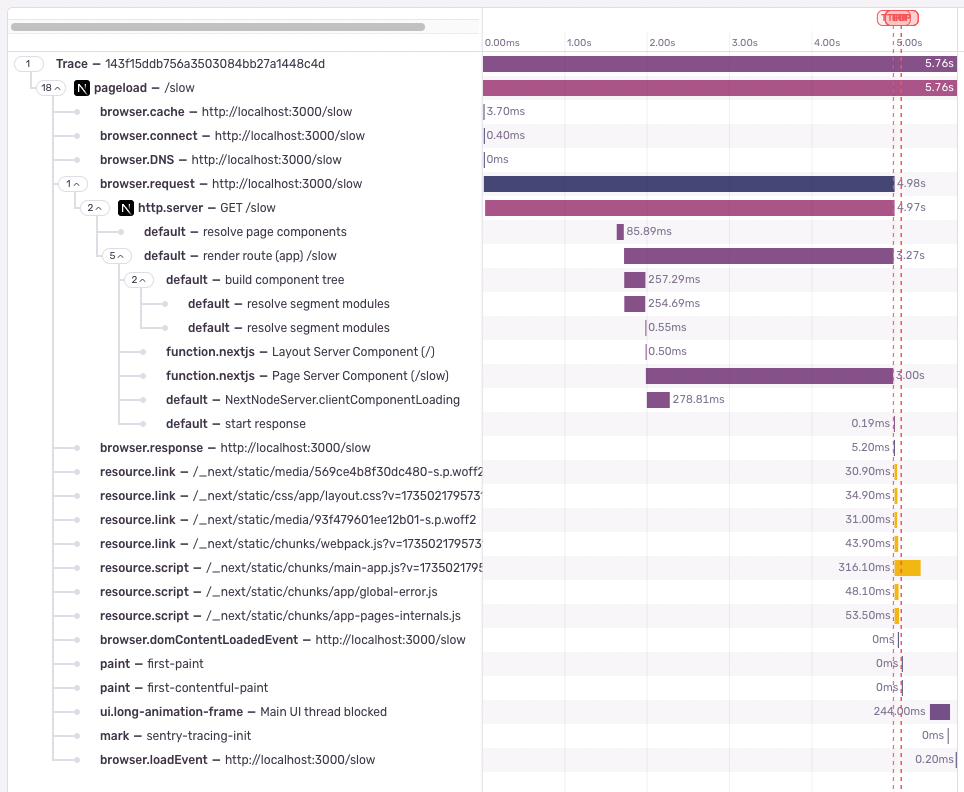
Detailed information about the relevant process is displayed.
- pageload: Total time to display the page (5.76 seconds)
- http.server: Time from when the browser sends the request until the result is returned (4.97 seconds)
- function.nextjs - Page Server Component: Processing time of the server action where we added the sleep (3 seconds)
- ui.long-animation-frame: Processing time of the main thread for UI display (0.244 seconds)
You can see where and how long processing took.
This gives you a good idea of where to start when working on performance improvements.
Supplement: Files Related to Sentry Settings
We set up the project with the following command:
npx @sentry/wizard@latet -i nextjs --saas --org shinagawa-web --project javascript-nextjs
This command creates several files for sending logs to Sentry.
Here’s an explanation of them.
sentry.client.config.ts
This file is the configuration file for initializing Sentry on the Next.js client side.
With this configuration, Sentry can automatically capture errors that occur in the browser and monitor performance.
import * as Sentry from "@sentry/nextjs";

Sentry.init({
  dsn: "https://xxx@xxx.ingest.us.sentry.io/4508520017494016",
  integrations: [
    Sentry.replayIntegration(),
  ],
  tracesSampleRate: 1,
  replaysSessionSampleRate: 0.1,
  replaysOnErrorSampleRate: 1.0,
  debug: false,
});
-
replayIntegration()- Enables Sentry’s Session Replay feature.
- Records user actions like a video so you can visualize the situation when an error occurred (useful for debugging).
-
tracesSampleRate- Sets the sampling rate for trace data.
- 1 means 100% of requests are traced (all requests are recorded).
- Adjusting this to an appropriate value can reduce Sentry data usage.
-
replaysSessionSampleRate- Sets the sampling rate for session replays under normal conditions.
- At 0.1, 10% of user sessions are recorded.
- During development, setting it to 1 makes debugging easier.
-
replaysOnErrorSampleRate- Sets the sampling rate for session replays when an error occurs.
- At 1.0, all sessions are recorded when an error occurs.
-
debug- When true, Sentry initialization and error capture behavior is logged in detail to the console.
It works with the default settings, but there are some improvements to consider for performance and security.
Improved version:
import * as Sentry from "@sentry/nextjs";

Sentry.init({
  dsn: process.env.NEXT_PUBLIC_SENTRY_DSN,
  integrations: [
    Sentry.replayIntegration(),
  ],
  tracesSampleRate: process.env.NODE_ENV === "production" ? 0.2 : 1,
  replaysSessionSampleRate: process.env.NODE_ENV === "production" ? 0.05 : 1,
  replaysOnErrorSampleRate: 1.0,
  debug: process.env.NODE_ENV !== "production",
});
Key points:
- Use an environment variable for the DSN (security measure).
- In production, set sampling rates to appropriate values to reduce unnecessary data sending.
- Set debug mode to true only in development for debugging, and false in production as recommended.
sentry.server.config.ts
This file is the configuration file for initializing Sentry on the Next.js server side.
It configures Sentry to send errors that occur in server-side processes such as API Routes, getServerSideProps, and middleware.
import * as Sentry from "@sentry/nextjs";

Sentry.init({
  dsn: "https://xxx@xxx.ingest.us.sentry.io/4508520017494016",
  tracesSampleRate: 1,
  debug: false,
});
As with the client-side configuration file, it’s better to change the sampling rate and debug mode between production and development environments.
sentry.edge.config.ts
This file is the configuration file for initializing Sentry for Next.js Edge features (Middleware, Edge Routes, etc.).
It enables error logging and performance monitoring in Edge environments.
import * as Sentry from "@sentry/nextjs";

Sentry.init({
  dsn: "https://xxx@xxx.ingest.us.sentry.io/4508520017494016",
  tracesSampleRate: 1,
  debug: false,
});
As with the server-side configuration file, it’s better to change the sampling rate and debug mode between production and development environments.
next.config.ts
This file integrates Sentry settings into Next.js using withSentryConfig.
withSentryConfig is a wrapper function that configures Sentry’s Webpack plugin and adds appropriate processing at build time.
import {withSentryConfig} from "@sentry/nextjs";
import type { NextConfig } from "next";

const nextConfig: NextConfig = {
  /* config options here */
};

export default withSentryConfig(nextConfig, {
  org: "shinagawa-web",
  project: "javascript-nextjs",
  silent: !process.env.CI,
  widenClientFileUpload: true,
  reactComponentAnnotation: {
    enabled: true,
  },
  tunnelRoute: "/monitoring",
  hideSourceMaps: true,
  disableLogger: true,
  automaticVercelMonitors: true,
});
Here’s a detailed explanation of the code above.
export default withSentryConfig(nextConfig, {
Wraps nextConfig with withSentryConfig and exports it as the Next.js configuration file with Sentry settings integrated.
silent: !process.env.CI,
- Log control in CI environments
- Controls log output when uploading source maps.
- In CI environments (when process.env.CI is true), logs are output; otherwise they are suppressed.
- Reduces unnecessary logs and build-time noise.
  reactComponentAnnotation: {
    enabled: true,
  },
- React component annotation
- Configures Sentry to include React component names in logs.
- Since component names are recorded, it’s easier to pinpoint the cause of errors.
hideSourceMaps: true,
- Hides source maps for client bundles
- Does not include source maps (.map files) in the generated bundle.
- Advantages
- Prevents source code leakage (improves security, especially in production).
- Reduces client bundle size.
- Disadvantages
- Makes debugging harder during development.
- For example, you might set it to false in development:
hideSourceMaps: process.env.NODE_ENV === "production",
In Closing
This completes the introduction and behavior verification of Sentry in a Next.js application. By leveraging Sentry, error monitoring and performance optimization become dramatically easier.
Please use these steps as a reference and try incorporating Sentry into your actual projects!
Questions about this article 📝
If you have any questions or feedback about the content, please feel free to contact us.Go to inquiry form
Related Articles
Robust Authorization Design for GraphQL and REST APIs: Best Practices for RBAC, ABAC, and OAuth 2.0
2024/05/13Introduction to Automating Development Work: A Complete Guide to ETL (Python), Bots (Slack/Discord), CI/CD (GitHub Actions), and Monitoring (Sentry/Datadog)
2024/02/12Chat App (with Image/PDF Sending and Video Call Features)
2024/07/15Practical Component Design Guide with React × Tailwind CSS × Emotion: The Optimal Approach to Design Systems, State Management, and Reusability
2024/11/22Management Dashboard Features (Graph Display, Data Import)
2024/06/02Tutorial for Implementing Authentication with Next.js and Auth.js
2024/09/13Thorough Comparison of the Best ORMs for the Next.js App Router: How to Choose Between Prisma / Drizzle / Kysely / TypeORM [Part 1]
2025/03/13Test Strategy in the Next.js App Router Era: Development Confidence Backed by Jest, RTL, and Playwright
2025/04/22


